Chapter 1: Classification
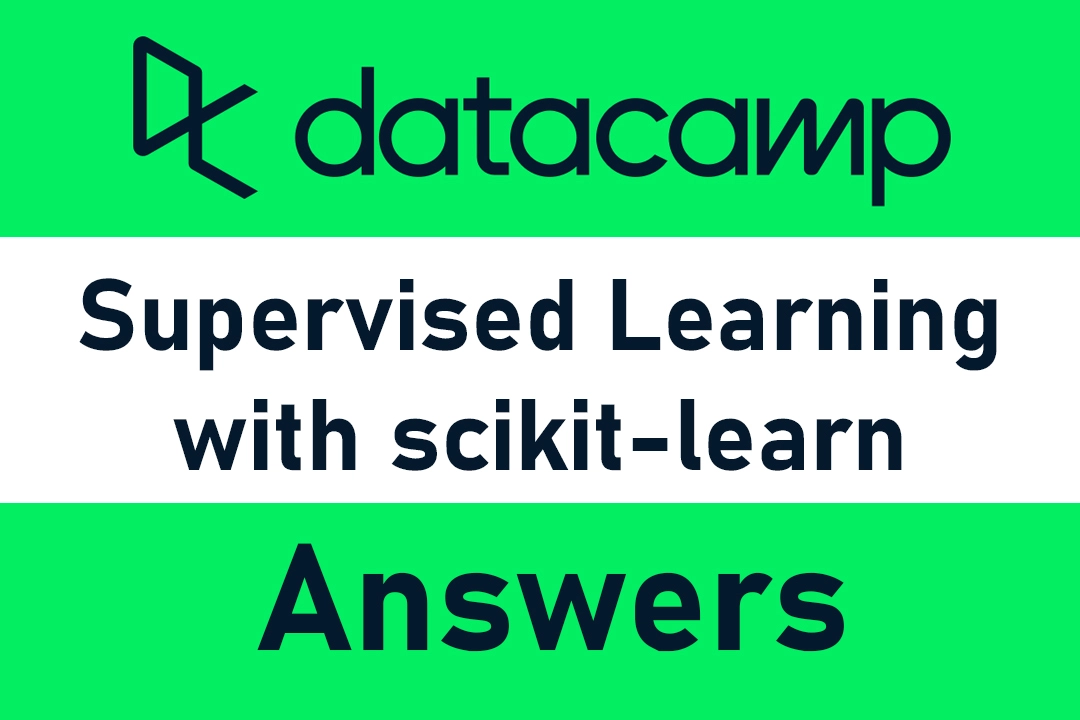
Which of these is a classification problem?
Once you decide to leverage supervised machine learning to solve a new problem, you need to identify whether your problem is better suited to classification or regression. This exercise will help you develop your intuition for distinguishing between the two. Provided below are 4 example applications of machine learning. Which of them is a supervised classification problem?
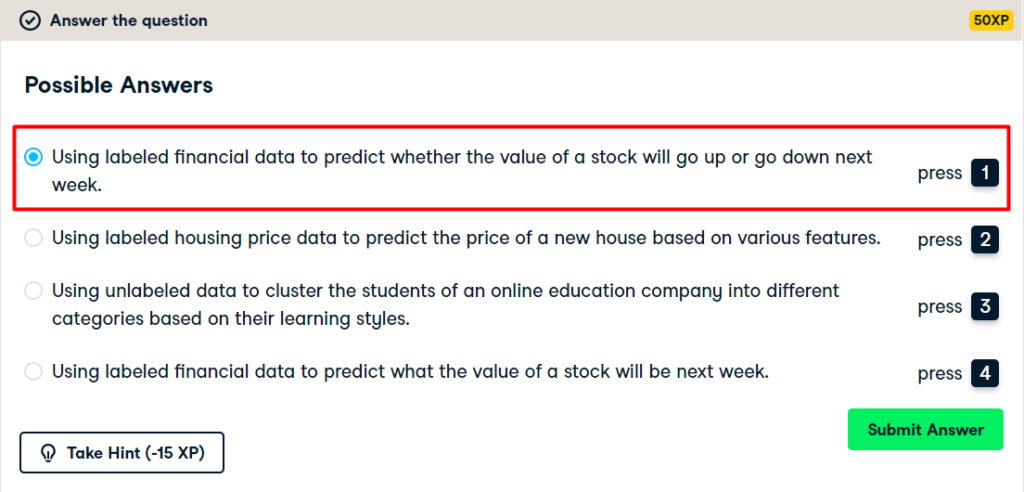
Numerical EDA
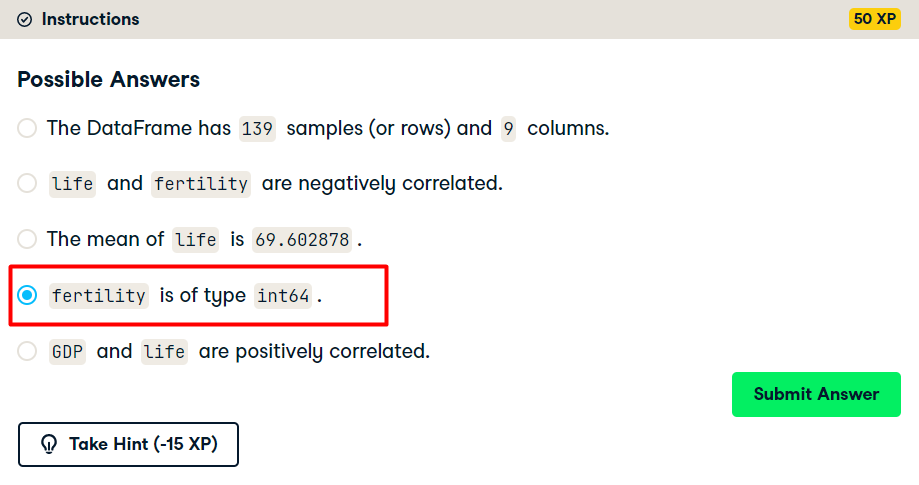
Get started with your EDA now by exploring this voting records dataset numerically. It has been pre-loaded for you into a DataFrame called df. Use pandas’ .head(), .info(), and .describe() methods in the IPython Shell to explore the DataFrame, and select the statement below that is not true.
Visual EDA

K-Nearest Neighbors: Fit
Instructions:
- Import
KNeighborsClassifierfromsklearn.neighbors. - Create arrays
Xandyfor the features and the target variable. Here this has been done for you. Note the use of.drop()to drop the target variable'party'from the feature arrayXas well as the use of the.valuesattribute to ensureXandyare NumPy arrays. Without using.values,Xandyare a DataFrame and Series respectively; the scikit-learn API will accept them in this form also as long as they are of the right shape. - Instantiate a
KNeighborsClassifiercalledknnwith6neighbors by specifying then_neighborsparameter. - Fit the classifier to the data using the
.fit()method.
# Import KNeighborsClassifier from sklearn.neighbors
from sklearn.neighbors import KNeighborsClassifier

# Create arrays for the features and the response variable
y = df['party'].values
X = df.drop('party', axis=1).values

# Create a k-NN classifier with 6 neighbors
knn = KNeighborsClassifier(n_neighbors=6)

# Fit the classifier to the data
knn.fit(X,y)
K-Nearest Neighbors: Predict
Instructions:
- Create arrays for the features and the target variable from
df. As a reminder, the target variable is'party'. - Instantiate a
KNeighborsClassifierwith6neighbors. - Fit the classifier to the data.
- Predict the labels of the training data,
X. - Predict the label of the new data point
X_new.
# Import KNeighborsClassifier from sklearn.neighbors
from sklearn.neighbors import KNeighborsClassifier

# Create arrays for the features and the response variable
y = df['party'].values
X = df.drop('party', axis=1).values

# Create a k-NN classifier with 6 neighbors: knn
knn = KNeighborsClassifier(n_neighbors=6)

# Fit the classifier to the data
knn.fit(X,y)

# Predict the labels for the training data X
y_pred = knn.predict(X)

# Predict and print the label for the new data point X_new
new_prediction = knn.predict(X_new)
print("Prediction: {}".format(new_prediction))
The digits recognition dataset
Instructions:
- Import
datasetsfromsklearnandmatplotlib.pyplotasplt. - Load the digits dataset using the
.load_digits()method ondatasets. - Print the keys and
DESCRof digits. - Print the shape of
imagesanddatakeys using the.notation. - Display the 1011th image using
plt.imshow(). This has been done for you, so hit submit to see which handwritten digit this happens to be!
# Import necessary modules
from sklearn import datasets
import matplotlib.pyplot as plt

# Load the digits dataset: digits
digits = datasets.load_digits()

# Print the keys and DESCR of the dataset
print(digits.keys())
print(digits['DESCR'])

# Print the shape of the images and data keys
print(digits.images.shape)
print(digits.data.shape)

# Display digit 1010
plt.imshow(digits.images[1010], cmap=plt.cm.gray_r, interpolation='nearest')
plt.show()
Train/Test Split + Fit/Predict/Accuracy
Instructions:
- Import
KNeighborsClassifierfromsklearn.neighborsandtrain_test_splitfromsklearn.model_selection. - Create an array for the features using
digits.dataand an array for the target usingdigits.target. - Create stratified training and test sets using
0.2for the size of the test set. Use a random state of42. Stratify the split according to the labels so that they are distributed in the training and test sets as they are in the original dataset. - Create a k-NN classifier with
7neighbors and fit it to the training data. - Compute and print the accuracy of the classifier’s predictions using the
.score()method.
# Import necessary modules
from sklearn.neighbors import KNeighborsClassifier
from sklearn.model_selection import train_test_split

# Create feature and target arrays
X = digits.data
y = digits.target

# Split into training and test set
X_train, X_test, y_train, y_test = train_test_split(X, y, test_size = 0.2, random_state=42, stratify=y)

# Create a k-NN classifier with 7 neighbors: knn
knn = knn = KNeighborsClassifier(n_neighbors = 7)

# Fit the classifier to the training data
knn.fit(X_train, y_train)

# Print the accuracy
print(knn.score(X_test, y_test))
Overfitting and underfitting
Instructions:
- Inside the for loop:
- Setup a k-NN classifier with the number of neighbors equal to
k. - Fit the classifier with
kneighbors to the training data. - Compute accuracy scores the training set and test set separately using the
.score()method and assign the results to thetrain_accuracyandtest_accuracyarrays respectively.
- Setup a k-NN classifier with the number of neighbors equal to
# Setup arrays to store train and test accuracies
neighbors = np.arange(1, 9)
train_accuracy = np.empty(len(neighbors))
test_accuracy = np.empty(len(neighbors))

# Loop over different values of k
for i, k in enumerate(neighbors):
    # Setup a k-NN Classifier with k neighbors: knn
    knn = KNeighborsClassifier(n_neighbors = k)

    # Fit the classifier to the training data
    knn.fit(X_train, y_train)

    #Compute accuracy on the training set
    train_accuracy[i] = knn.score(X_train, y_train)

    #Compute accuracy on the testing set
    test_accuracy[i] = knn.score(X_test, y_test)

# Generate plot
plt.title('k-NN: Varying Number of Neighbors')
plt.plot(neighbors, test_accuracy, label = 'Testing Accuracy')
plt.plot(neighbors, train_accuracy, label = 'Training Accuracy')
plt.legend()
plt.xlabel('Number of Neighbors')
plt.ylabel('Accuracy')
plt.show()
Chapter 2: Regression
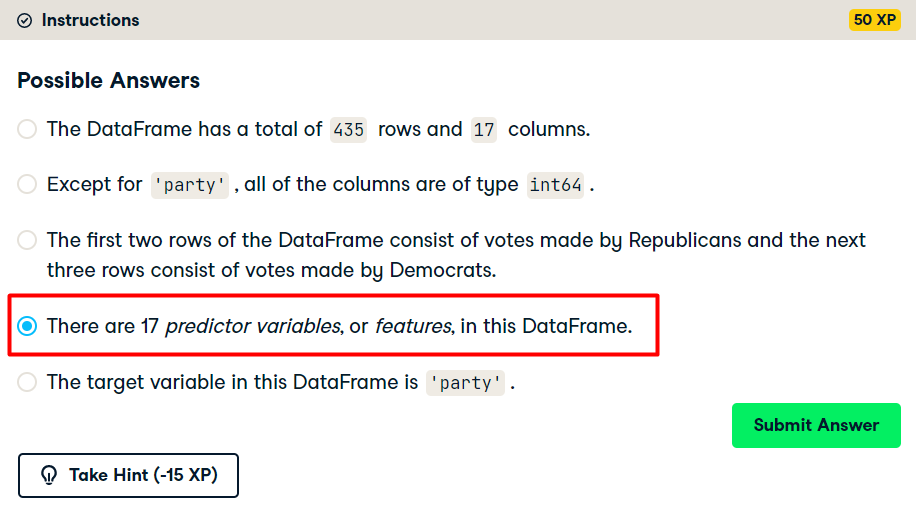
Which of the following is a regression problem?
Andy introduced regression to you using the Boston housing dataset. But regression models can be used in a variety of contexts to solve a variety of different problems. Given below are four example applications of machine learning. Your job is to pick the one that is best framed as a regression problem.
Importing data for supervised learning
Instructions:
- Import
numpyandpandasas their standard aliases. - Read the file
'gapminder.csv'into a DataFramedfusing theread_csv()function. - Create array
Xfor the'fertility'feature and arrayyfor the'life'target variable. - Reshape the arrays by using the
.reshape()method and passing in-1and1.
# Import numpy and pandas
import numpy as np
import pandas as pd

# Read the CSV file into a DataFrame: df
df = pd.read_csv('gapminder.csv')

# Create arrays for features and target variable
y = df['life']
X = df['fertility']

# Print the dimensions of y and X before reshaping
print("Dimensions of y before reshaping: ", y.shape)
print("Dimensions of X before reshaping: ", X.shape)

# Reshape X and y
y_reshaped = y.reshape(-1,1)
X_reshaped = X.reshape(-1,1)

# Print the dimensions of y_reshaped and X_reshaped
print("Dimensions of y after reshaping: ", y_reshaped.shape)
print("Dimensions of X after reshaping: ", X_reshaped.shape)
Exploring the Gapminder data
Fit & predict for regression
Instructions:
- Import
LinearRegressionfromsklearn.linear_model. - Create a
LinearRegressionregressor calledreg. - Set up the prediction space to range from the minimum to the maximum of
X_fertility. This has been done for you. - Fit the regressor to the data (
X_fertilityandy) and compute its predictions using the.predict()method and theprediction_spacearray. - Compute and print the R2 score using the
.score()method. - Overlay the plot with your linear regression line. This has been done for you, so hit submit to see the result!
# Import LinearRegression
from sklearn.linear_model import LinearRegression

# Create the regressor: reg
reg = LinearRegression()

# Create the prediction space
prediction_space = np.linspace(min(X_fertility), max(X_fertility)).reshape(-1,1)

# Fit the model to the data
reg.fit(X_fertility,y)

# Compute predictions over the prediction space: y_pred
y_pred = reg.predict(prediction_space)

# Print R^2
print(reg.score(X_fertility, y))

# Plot regression line
plt.plot(prediction_space, y_pred, color='black', linewidth=3)
plt.show()
Train/test split for regression
Instructions:
- Import
LinearRegressionfromsklearn.linear_model,mean_squared_errorfromsklearn.metrics, andtrain_test_splitfromsklearn.model_selection. - Using
Xandy, create training and test sets such that 30% is used for testing and 70% for training. Use a random state of42. - Create a linear regression regressor called
reg_all, fit it to the training set, and evaluate it on the test set. - Compute and print the R2 score using the
.score()method on the test set. - Compute and print the RMSE. To do this, first compute the Mean Squared Error using the
mean_squared_error()function with the argumentsy_testandy_pred, and then take its square root usingnp.sqrt().
# Import necessary modules
from sklearn.linear_model import LinearRegression
from sklearn.metrics import mean_squared_error
from sklearn.model_selection import train_test_split

# Create training and test sets
X_train, X_test, y_train, y_test = train_test_split(X, y, test_size = 0.3, random_state=42)

# Create the regressor: reg_all
reg_all = LinearRegression()

# Fit the regressor to the training data
reg_all.fit(X_train,y_train)

# Predict on the test data: y_pred
y_pred = reg_all.predict(X_test)

# Compute and print R^2 and RMSE
err = mean_squared_error(y_test,y_pred)
print("R^2: {}".format(reg_all.score(X_test, y_test)))
rmse = np.sqrt(err)
print("Root Mean Squared Error: {}".format(rmse))
5-fold cross-validation
Instructions:
- Import
LinearRegressionfromsklearn.linear_modelandcross_val_scorefromsklearn.model_selection. - Create a linear regression regressor called
reg. - Use the
cross_val_score()function to perform 5-fold cross-validation onXandy. - Compute and print the average cross-validation score. You can use NumPy’s
mean()function to compute the average.
# Import the necessary modules
from sklearn.linear_model import LinearRegression
from sklearn.model_selection import cross_val_score

# Create a linear regression object: reg
reg = LinearRegression()

# Compute 5-fold cross-validation scores: cv_scores
cv_scores = cross_val_score(reg, X, y, cv=5)

# Print the 5-fold cross-validation scores
print(cv_scores)

print("Average 5-Fold CV Score: {}".format(cv_scores.mean()))
K-Fold CV comparison
Instructions:
- Import
LinearRegressionfromsklearn.linear_modelandcross_val_scorefromsklearn.model_selection. - Create a linear regression regressor called
reg. - Perform 3-fold CV and then 10-fold CV. Compare the resulting mean scores.
# Import necessary modules
from sklearn.linear_model import LinearRegression
from sklearn.model_selection import cross_val_score

# Create a linear regression object: reg
reg = LinearRegression()

# Perform 3-fold CV
cvscores_3 = cross_val_score(reg, X, y, cv = 3)
print(np.mean(cvscores_3))

# Perform 10-fold CV
cvscores_10 = cross_val_score(reg, X, y, cv = 10)
print(np.mean(cvscores_10))
Regularization I: Lasso
Instructions:
- Import
Lassofromsklearn.linear_model. - Instantiate a Lasso regressor with an alpha of
0.4and specifynormalize=True. - Fit the regressor to the data and compute the coefficients using the
coef_attribute. - Plot the coefficients on the y-axis and column names on the x-axis. This has been done for you, so hit submit to view the plot!
# Import Lasso
from sklearn.linear_model import Lasso

# Instantiate a lasso regressor: lasso
lasso = Lasso(alpha=0.4, normalize=True)

# Fit the regressor to the data
lasso.fit(X, y)

# Compute and print the coefficients
lasso_coef = lasso.fit(X, y).coef_
print(lasso_coef)

# Plot the coefficients
plt.plot(range(len(df_columns)), lasso_coef)
plt.xticks(range(len(df_columns)), df_columns.values, rotation=60)
plt.margins(0.02)
plt.show()
Regularization II: Ridge
Instructions:
- Instantiate a Ridge regressor and specify
normalize=True. - Inside the
forloop:- Specify the alpha value for the regressor to use.
- Perform 10-fold cross-validation on the regressor with the specified alpha. The data is available in the arrays
Xandy. - Append the average and the standard deviation of the computed cross-validated scores. NumPy has been pre-imported for you as
np.
- Use the
display_plot()function to visualize the scores and standard deviations.
# Import necessary modules
from sklearn.linear_model import Ridge
from sklearn.model_selection import cross_val_score

# Setup the array of alphas and lists to store scores
alpha_space = np.logspace(-4, 0, 50)
ridge_scores = []
ridge_scores_std = []

# Create a ridge regressor: ridge
ridge = Ridge(normalize=True)

# Compute scores over range of alphas
for alpha in alpha_space:

    # Specify the alpha value to use: ridge.alpha
    ridge.alpha = alpha

    # Perform 10-fold CV: ridge_cv_scores
    ridge_cv_scores = cross_val_score(ridge, X, y, cv=10)

    # Append the mean of ridge_cv_scores to ridge_scores
    ridge_scores.append(np.mean(ridge_cv_scores))

    # Append the std of ridge_cv_scores to ridge_scores_std
    ridge_scores_std.append(np.std(ridge_cv_scores))

# Display the plot
display_plot(ridge_scores, ridge_scores_std)
Chapter 3: Fine-tuning your model
Metrics for classification
Instructions:
- Import
classification_reportandconfusion_matrixfromsklearn.metrics. - Create training and testing sets with 40% of the data used for testing. Use a random state of
42. - Instantiate a k-NN classifier with
6neighbors, fit it to the training data, and predict the labels of the test set. - Compute and print the confusion matrix and classification report using the
confusion_matrix()andclassification_report()functions.
# Import necessary modules
from sklearn.metrics import classification_report, confusion_matrix

# Create training and test set
X_train, X_test, y_train, y_test = train_test_split(X, y, test_size = 0.4, random_state=42)

# Instantiate a k-NN classifier: knn
knn = KNeighborsClassifier(n_neighbors=6)

# Fit the classifier to the training data
knn.fit(X_train,y_train)

# Predict the labels of the test data: y_pred
y_pred = knn.predict(X_test)

# Generate the confusion matrix and classification report
print(classification_report(y_test, y_pred))
print(confusion_matrix(y_test, y_pred))
Building a logistic regression model
Instructions:
- Import:
LogisticRegressionfromsklearn.linear_model.confusion_matrixandclassification_reportfromsklearn.metrics.
- Create training and test sets with 40% (or
0.4) of the data used for testing. Use a random state of42. This has been done for you. - Instantiate a
LogisticRegressionclassifier calledlogreg. - Fit the classifier to the training data and predict the labels of the test set.
- Compute and print the confusion matrix and classification report. This has been done for you, so hit submit to see how logistic regression compares to k-NN!
# Import the necessary modules
from sklearn.linear_model import LogisticRegression
from sklearn.metrics import confusion_matrix, classification_report

# Create training and test sets
X_train, X_test, y_train, y_test = train_test_split(X, y, test_size = 0.4, random_state=42)

# Create the classifier: logreg
logreg = LogisticRegression()

# Fit the classifier to the training data
logreg.fit(X_train,y_train)

# Predict the labels of the test set: y_pred
y_pred = logreg.predict(X_test)

# Compute and print the confusion matrix and classification report
print(confusion_matrix(y_test, y_pred))
print(classification_report(y_test, y_pred))
Plotting an ROC curve
Instructions:
- Import
roc_curvefromsklearn.metrics. - Using the
logregclassifier, which has been fit to the training data, compute the predicted probabilities of the labels of the test setX_test. Save the result asy_pred_prob. - Use the
roc_curve()function withy_testandy_pred_proband unpack the result into the variablesfpr,tpr, andthresholds. - Plot the ROC curve with
fpron the x-axis andtpron the y-axis.
# Import necessary modules
from sklearn.metrics import roc_curve

# Compute predicted probabilities: y_pred_prob
y_pred_prob = logreg.predict_proba(X_test)[:,1]

# Generate ROC curve values: fpr, tpr, thresholds
fpr, tpr, thresholds = roc_curve(y_test, y_pred_prob)

# Plot ROC curve
plt.plot([0, 1], [0, 1], 'k--')
plt.plot(fpr, tpr)
plt.xlabel('False Positive Rate')
plt.ylabel('True Positive Rate')
plt.title('ROC Curve')
plt.show()
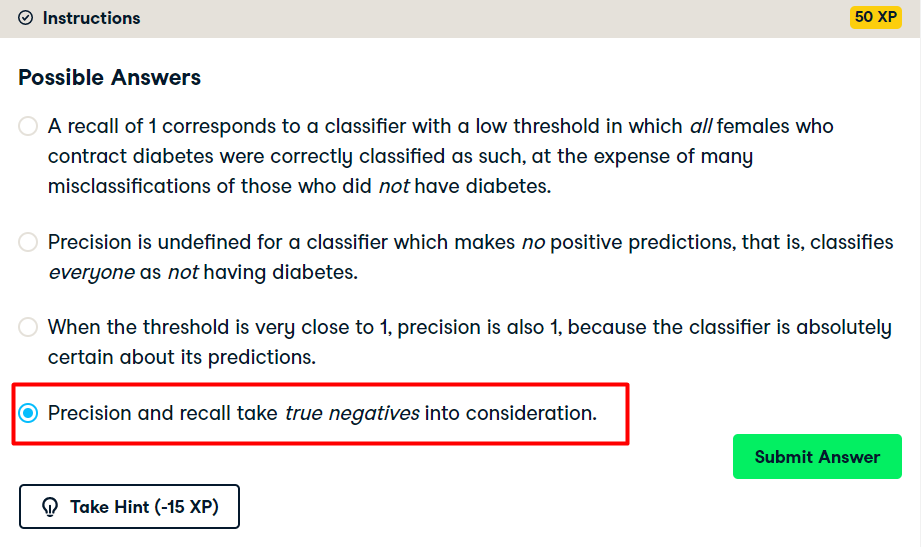
Precision-recall Curve
AUC computation
Instructions:
- Import
roc_auc_scorefromsklearn.metricsandcross_val_scorefromsklearn.model_selection. - Using the
logregclassifier, which has been fit to the training data, compute the predicted probabilities of the labels of the test setX_test. Save the result asy_pred_prob. - Compute the AUC score using the
roc_auc_score()function, the test set labelsy_test, and the predicted probabilitiesy_pred_prob. - Compute the AUC scores by performing 5-fold cross-validation. Use the
cross_val_score()function and specify thescoringparameter to be'roc_auc'.
# Import necessary modules
from sklearn.metrics import roc_auc_score
from sklearn.model_selection import cross_val_score

# Compute predicted probabilities: y_pred_prob
y_pred_prob = logreg.predict_proba(X_test)[:,1]

# Compute and print AUC score
print("AUC: {}".format(roc_auc_score(y_test, y_pred_prob)))

# Compute cross-validated AUC scores: cv_auc
cv_auc = cross_val_score(logreg, X, y, cv=5, scoring='roc_auc')

# Print list of AUC scores
print("AUC scores computed using 5-fold cross-validation: {}".format(cv_auc))
Hyperparameter tuning with GridSearchCV
Instructions:
- Import
LogisticRegressionfromsklearn.linear_modelandGridSearchCVfromsklearn.model_selection. - Setup the hyperparameter grid by using
c_spaceas the grid of values to tune C over. - Instantiate a logistic regression classifier called
logreg. - Use
GridSearchCVwith 5-fold cross-validation to tune C:- Inside
GridSearchCV(), specify the classifier, parameter grid, and number of folds to use. - Use the
.fit()method on theGridSearchCVobject to fit it to the dataXandy.
- Inside
- Print the best parameter and best score obtained from
GridSearchCVby accessing thebest_params_andbest_score_attributes oflogreg_cv.
# Import necessary modules
from sklearn.linear_model import LogisticRegression
from sklearn.model_selection import GridSearchCV

# Setup the hyperparameter grid
c_space = np.logspace(-5, 8, 15)
param_grid = {'C': c_space}

# Instantiate a logistic regression classifier: logreg
logreg = LogisticRegression(solver="liblinear")

# Instantiate the GridSearchCV object: logreg_cv
logreg_cv = GridSearchCV(logreg, param_grid, cv=5)

# Fit it to the data
logreg_cv.fit(X,y)

# Print the tuned parameters and score
print("Tuned Logistic Regression Parameters: {}".format(logreg_cv.best_params_))
print("Best score is {}".format(logreg_cv.best_score_))
Hyperparameter tuning with RandomizedSearchCV
Instructions:
- Import
DecisionTreeClassifierfromsklearn.treeandRandomizedSearchCVfromsklearn.model_selection. - Specify the parameters and distributions to sample from. This has been done for you.
- Instantiate a
DecisionTreeClassifier. - Use
RandomizedSearchCVwith 5-fold cross-validation to tune the hyperparameters:- Inside
RandomizedSearchCV(), specify the classifier, parameter distribution, and number of folds to use. - Use the
.fit()method on theRandomizedSearchCVobject to fit it to the dataXandy.
- Inside
- Print the best parameter and best score obtained from
RandomizedSearchCVby accessing thebest_params_andbest_score_attributes oftree_cv.
# Import necessary modules
from scipy.stats import randint
from sklearn.tree import DecisionTreeClassifier
from sklearn.model_selection import RandomizedSearchCV


# Setup the parameters and distributions to sample from: param_dist
param_dist = {"max_depth": [3, None],
              "max_features": randint(1, 9),
              "min_samples_leaf": randint(1, 9),
              "criterion": ["gini", "entropy"]}

# Instantiate a Decision Tree classifier: tree
tree = DecisionTreeClassifier()

# Instantiate the RandomizedSearchCV object: tree_cv
tree_cv = RandomizedSearchCV(tree, param_dist, cv=5)

# Fit it to the data
tree_cv.fit(X, y)

# Print the tuned parameters and score
print("Tuned Decision Tree Parameters: {}".format(tree_cv.best_params_))
print("Best score is {}".format(tree_cv.best_score_))
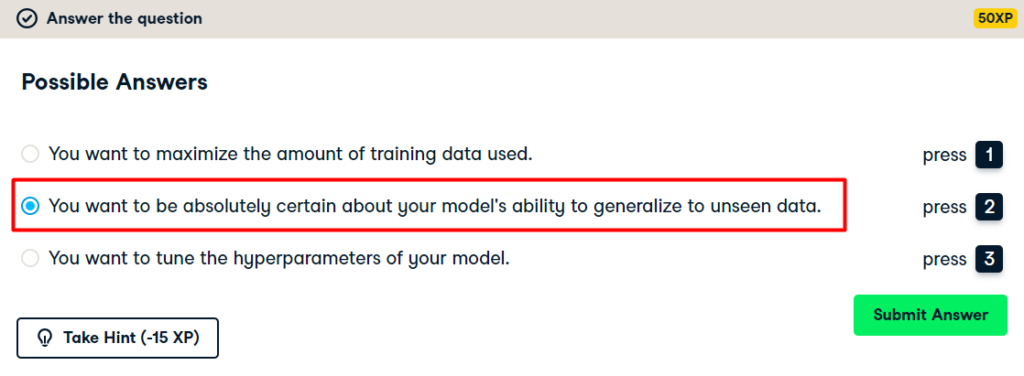
Hold-out set reasoning
Hold-out set in practice I: Classification
Instructions:
- Create the hyperparameter grid:
- Use the array
c_spaceas the grid of values for'C'. - For
'penalty', specify a list consisting of'l1'and'l2'.
- Use the array
- Instantiate a logistic regression classifier.
- Create training and test sets. Use a
test_sizeof0.4andrandom_stateof42. In practice, the test set here will function as the hold-out set. - Tune the hyperparameters on the training set using
GridSearchCVwith 5-folds. This involves first instantiating theGridSearchCVobject with the correct parameters and then fitting it to the training data. - Print the best parameter and best score obtained from
GridSearchCVby accessing thebest_params_andbest_score_attributes oflogreg_cv.
# Import necessary modules
from sklearn.model_selection import train_test_split
from sklearn.linear_model import LogisticRegression
from sklearn.model_selection import GridSearchCV

# Create the hyperparameter grid
c_space = np.logspace(-5, 8, 15)
param_grid = {'C': c_space, 'penalty': ['l1', 'l2']}

# Instantiate the logistic regression classifier: logreg
logreg = LogisticRegression(solver='liblinear')

# Create train and test sets
X_train, X_test, y_train, y_test = train_test_split(X, y, test_size=0.4, random_state=42)

# Instantiate the GridSearchCV object: logreg_cv
logreg_cv = GridSearchCV(logreg, param_grid, cv=5)

# Fit it to the training data
logreg_cv.fit(X_train, y_train)

# Print the optimal parameters and best score
print("Tuned Logistic Regression Parameter: {}".format(logreg_cv.best_params_))
print("Tuned Logistic Regression Accuracy: {}".format(logreg_cv.best_score_))
Hold-out set in practice II: Regression
Instructions:
- Import the following modules:
ElasticNetfromsklearn.linear_model.mean_squared_errorfromsklearn.metrics.GridSearchCVandtrain_test_splitfromsklearn.model_selection.
- Create training and test sets, with 40% of the data used for the test set. Use a random state of
42. - Specify the hyperparameter grid for
'l1_ratio'usingl1_spaceas the grid of values to search over. - Instantiate the
ElasticNetregressor. - Use
GridSearchCVwith 5-fold cross-validation to tune'l1_ratio'on the training dataX_trainandy_train. This involves first instantiating theGridSearchCVobject with the correct parameters and then fitting it to the training data. - Predict on the test set and compute the R2 and mean squared error.
# Import necessary modules
from sklearn.linear_model import ElasticNet
from sklearn.metrics import mean_squared_error
from sklearn.model_selection import GridSearchCV, train_test_split

# Create train and test sets
X_train, X_test, y_train, y_test = train_test_split(X, y, test_size=0.4, random_state=42)

# Create the hyperparameter grid
l1_space = np.linspace(0, 1, 30)
param_grid = {'l1_ratio': l1_space}

# Instantiate the ElasticNet regressor: elastic_net
elastic_net = ElasticNet()

# Setup the GridSearchCV object: gm_cv
gm_cv = GridSearchCV(elastic_net, param_grid, cv=5)

# Fit it to the training data
gm_cv.fit(X_train, y_train)

# Predict on the test set and compute metrics
y_pred = gm_cv.predict(X_test)
r2 = gm_cv.score(X_test, y_test)
mse = mean_squared_error(y_test, y_pred)
print("Tuned ElasticNet l1 ratio: {}".format(gm_cv.best_params_))
print("Tuned ElasticNet R squared: {}".format(r2))
print("Tuned ElasticNet MSE: {}".format(mse))
Chapter 4: Preprocessing and pipelines
Exploring categorical features
Instructions:
- Import
pandasaspd. - Read the CSV file
'gapminder.csv'into a DataFrame calleddf. - Use pandas to create a boxplot showing the variation of life expectancy (
'life') by region ('Region'). To do so, pass the column names in todf.boxplot()(in that order).
# Import pandas
import pandas as pd

# Read 'gapminder.csv' into a DataFrame: df
df = pd.read_csv('gapminder.csv')

# Create a boxplot of life expectancy per region
df.boxplot('life', 'Region', rot=60)

# Show the plot
plt.show()
Creating dummy variables
Instructions:
- Use the pandas
get_dummies()function to create dummy variables from thedfDataFrame. Store the result asdf_region. - Print the columns of
df_region. This has been done for you. - Use the
get_dummies()function again, this time specifyingdrop_first=Trueto drop the unneeded dummy variable (in this case,'Region_America'). - Hit submit to print the new columns of
df_regionand take note of how one column was dropped!
# Create dummy variables: df_region
df_region = pd.get_dummies(df)

# Print the columns of df_region
print(df_region.columns)

# Create dummy variables with drop_first=True: df_region
df_region = pd.get_dummies(df, drop_first=True)

# Print the new columns of df_region
print(df_region.columns)
Regression with categorical features
Instructions:
- Import
Ridgefromsklearn.linear_modelandcross_val_scorefromsklearn.model_selection. - Instantiate a ridge regressor called
ridgewithalpha=0.5andnormalize=True. - Perform 5-fold cross-validation on
Xandyusing thecross_val_score()function. - Print the cross-validated scores.
# Import necessary modules
from sklearn.linear_model import Ridge
from sklearn.model_selection import cross_val_score

# Instantiate a ridge regressor: ridge
ridge = Ridge(alpha=0.5, normalize=True)

# Perform 5-fold cross-validation: ridge_cv
ridge_cv = cross_val_score(ridge, X, y, cv=5)

# Print the cross-validated scores
print(ridge_cv)
Dropping missing data
Instructions:
- Explore the DataFrame
dfin the IPython Shell. Notice how the missing value is represented. - Convert all
'?'data points tonp.nan. - Count the total number of NaNs using the
.isnull()and.sum()methods. This has been done for you. - Drop the rows with missing values from
dfusing.dropna(). - Hit submit to see how many rows were lost by dropping the missing values.
# Convert '?' to NaN
df[df == '?'] = np.nan

# Print the number of NaNs
print(df.isnull().sum())

# Print shape of original DataFrame
print("Shape of Original DataFrame: {}".format(df.shape))

# Drop missing values and print shape of new DataFrame
df = df.dropna()

# Print shape of new DataFrame
print("Shape of DataFrame After Dropping All Rows with Missing Values {}".format(df.shape))
Imputing missing data in a ML Pipeline I
Instructions:
- Import
Imputerfromsklearn.preprocessingandSVCfromsklearn.svm. SVC stands for Support Vector Classification, which is a type of SVM. - Setup the Imputation transformer to impute missing data (represented as
'NaN') with the'most_frequent'value in the column (axis=0). - Instantiate a
SVCclassifier. Store the result inclf. - Create the steps of the pipeline by creating a list of tuples:
- The first tuple should consist of the imputation step, using
imp. - The second should consist of the classifier.
- The first tuple should consist of the imputation step, using
# Import the Imputer module
from sklearn.preprocessing import Imputer
from sklearn.svm import SVC

# Setup the Imputation transformer: imp
imp = Imputer(missing_values='NaN', strategy='most_frequent', axis=0)

# Instantiate the SVC classifier: clf
clf = SVC()

# Setup the pipeline with the required steps: steps
steps = [('imputation', imp), ('SVM', clf)]
Imputing missing data in a ML Pipeline II
Instructions:
- Import the following modules:
Imputerfromsklearn.preprocessingandPipelinefromsklearn.pipeline.SVCfromsklearn.svm.
- Create the pipeline using
Pipeline()andsteps. - Create training and test sets. Use 30% of the data for testing and a random state of
42. - Fit the pipeline to the training set and predict the labels of the test set.
- Compute the classification report.
# Import necessary modules
from sklearn.preprocessing import Imputer
from sklearn.pipeline import Pipeline
from sklearn.svm import SVC

# Setup the pipeline steps: steps
steps = [('imputation', Imputer(missing_values='NaN', strategy='most_frequent', axis=0)),
        ('SVM', SVC())]

# Create the pipeline: pipeline
pipeline = Pipeline(steps)

# Create training and test sets
X_train, X_test, y_train, y_test = train_test_split(X, y, test_size=0.3, random_state=42)

# Fit the pipeline to the train set
pipeline.fit(X_train, y_train)

# Predict the labels of the test set
y_pred = pipeline.predict(X_test)

# Compute metrics
print(classification_report(y_test, y_pred))
Centering and scaling your data
Instructions:
- Import
scalefromsklearn.preprocessing. - Scale the features
Xusingscale(). - Print the mean and standard deviation of the unscaled features
X, and then the scaled featuresX_scaled. Use the numpy functionsnp.mean()andnp.std()to compute the mean and standard deviations.
# Import scale
from sklearn.preprocessing import scale

# Scale the features: X_scaled
X_scaled = scale(X)

# Print the mean and standard deviation of the unscaled features
print("Mean of Unscaled Features: {}".format(np.mean(X)))
print("Standard Deviation of Unscaled Features: {}".format(np.std(X)))

# Print the mean and standard deviation of the scaled features
print("Mean of Scaled Features: {}".format(np.mean(X_scaled)))
print("Standard Deviation of Scaled Features: {}".format(np.std(X_scaled)))
Centering and scaling in a pipeline
Instructions:
- Import the following modules:
StandardScalerfromsklearn.preprocessing.Pipelinefromsklearn.pipeline.
- Complete the steps of the pipeline with
StandardScaler()for'scaler'andKNeighborsClassifier()for'knn'. - Create the pipeline using
Pipeline()andsteps. - Create training and test sets, with 30% used for testing. Use a random state of
42. - Fit the pipeline to the training set.
- Compute the accuracy scores of the scaled and unscaled models by using the
.score()method inside the providedprint()functions.
# Import the necessary modules
from sklearn.preprocessing import StandardScaler
from sklearn.pipeline import Pipeline

# Setup the pipeline steps: steps
steps = [('scaler', StandardScaler()),
        ('knn', KNeighborsClassifier())]

# Create the pipeline: pipeline
pipeline = Pipeline(steps)

# Create train and test sets
X_train, X_test, y_train, y_test = train_test_split(X, y, test_size=0.3, random_state=42)

# Fit the pipeline to the training set: knn_scaled
knn_scaled = pipeline.fit(X_train, y_train)

# Instantiate and fit a k-NN classifier to the unscaled data
knn_unscaled = KNeighborsClassifier().fit(X_train, y_train)

# Compute and print metrics
print('Accuracy with Scaling: {}'.format(knn_scaled.score(X_test, y_test)))
print('Accuracy without Scaling: {}'.format(knn_unscaled.score(X_test, y_test)))
Bringing it all together I: Pipeline for classification
Instructions:
- Setup the pipeline with the following steps:
- Scaling, called
'scaler'withStandardScaler(). - Classification, called
'SVM'withSVC().
- Scaling, called
- Specify the hyperparameter space using the following notation:
'step_name__parameter_name'. Here, thestep_nameisSVM, and theparameter_names areCandgamma. - Create training and test sets, with 20% of the data used for the test set. Use a random state of
21. - Instantiate
GridSearchCVwith the pipeline and hyperparameter space and fit it to the training set. Use 3-fold cross-validation (This is the default, so you don’t have to specify it). - Predict the labels of the test set and compute the metrics. The metrics have been computed for you.
# Setup the pipeline
steps = [('scaler', StandardScaler()),
         ('SVM', SVC())]

pipeline = Pipeline(steps)

# Specify the hyperparameter space
parameters = {'SVM__C':[1, 10, 100],
              'SVM__gamma':[0.1, 0.01]}

# Create train and test sets
X_train, X_test, y_train, y_test = train_test_split(X, y, test_size=0.2, random_state=21)

# Instantiate the GridSearchCV object: cv
cv = GridSearchCV(pipeline, parameters, cv=3)

# Fit to the training set
cv.fit(X_train, y_train)

# Predict the labels of the test set: y_pred
y_pred = cv.predict(X_test)

# Compute and print metrics
print("Accuracy: {}".format(cv.score(X_test, y_test)))
print(classification_report(y_test, y_pred))
print("Tuned Model Parameters: {}".format(cv.best_params_))
Bringing it all together II: Pipeline for regression
Instructions:
- Set up a pipeline with the following steps:
'imputation', which uses theImputer()transformer and the'mean'strategy to impute missing data ('NaN') using the mean of the column.'scaler', which scales the features usingStandardScaler().'elasticnet', which instantiates anElasticNet()regressor.
- Specify the hyperparameter space for the l1 ratio using the following notation:
'step_name__parameter_name'. Here, thestep_nameiselasticnet, and theparameter_nameisl1_ratio. - Create training and test sets, with 40% of the data used for the test set. Use a random state of
42. - Instantiate
GridSearchCVwith the pipeline and hyperparameter space. Use 3-fold cross-validation (This is the default, so you don’t have to specify it). - Fit the
GridSearchCVobject to the training set. - Compute R2 and the best parameters. This has been done for you, so hit submit to see the results!
# Setup the pipeline steps: steps
steps = [('imputation', Imputer(missing_values='NaN', strategy='mean')),
         ('scaler', StandardScaler()),
         ('elasticnet', ElasticNet())]

# Create the pipeline: pipeline
pipeline = Pipeline(steps)

# Specify the hyperparameter space
parameters = {'elasticnet__l1_ratio':np.linspace(0,1,30)}

# Create train and test sets
X_train, X_test, y_train, y_test = train_test_split(X, y, test_size=0.4, random_state=42)

# Create the GridSearchCV object: gm_cv
gm_cv = GridSearchCV(pipeline, parameters, cv=3)

# Fit to the training set
gm_cv.fit(X_train, y_train)

# Compute and print the metrics
r2 = gm_cv.score(X_test, y_test)
print("Tuned ElasticNet Alpha: {}".format(gm_cv.best_params_))
print("Tuned ElasticNet R squared: {}".format(r2))
➤ If you want to learn, what is linear regression? – Click here.
➤ If you want to learn, own implementation of Simple Linear Regression – Click here
Thank you for reading this blog. If you have any query about this #Datacamp course "Supervised Learning with scikit-learn", feel free to ask by comment. Thank you again.


Hi all, here every one is sharing these kinds of knowledge, thus it’s pleasant to read
this webpage, and I used to go to see this weblog everyday.
thank you very much
I’m glad my effort helped you. You are welcome! 😊😊😊
not working
What is not working DavidMiz?
Can you please elaborate on your question?
Thank you.
I apologise, but, in my opinion, you are not right. I am assured. Let’s discuss. Write to me in PM, we will communicate.
I appreciate your perspective, and I respect your opinion. It’s great to have different perspectives. I’d love to discuss further to understand your point of view. What aspect do you think I might have missed?
In it something is.
Absolutely, there’s depth in every corner. Thank you dear 😊
home decor [url=http://brus-online.com/#dollar-store]diy craft[/url].
interesting post
I’m glad you found the post interesting! Thank you dear 😊
Excuse for that I interfere … I understand this question. I invite to discussion. Write here or in PM.
I appreciate your willingness to engage in discussion. Please feel free to share your thoughts here 😊
not working
What is not working Jeffreywreta?
Can you please elaborate on your question?
Thank you.
Thank you for reaching out with your investment opportunities. At the moment, we’re not seeking additional investment for our projects. However, I appreciate your offer and will keep your contact information for future reference if our circumstances change. 😊
I with you agree. In it something is. Now all became clear, I thank for the help in this question.
Thank you @novopet, It means a lot dear 😊
Thanks for the help in this question, the easier, the better …
Thank you @avenue, It means a lot 😊
And it has analogue?
Sorry @novoPet, I couldn’t get your question. Can you please elaborate? Thank you 😊
Thanks for the post
You’re welcome! If you have any other questions or need assistance, just let me know. 😊
You’ve made some decent points there. I checked
on the net for more information about the issue
and found most people will go along with your views on this website.
Thank you for your feedback! I’m glad to hear that you found the points I made to be helpful and that they align with the views of others. If you have any further questions or need additional information, feel free to ask! 😊
I love the look of your website. I recently built mine and I was looking for some design ideas and you gave me a few. May I ask you whether you developed the website by youself?
Thank you very much for your kind words! I’m delighted to hear that you found inspiration from my website design. Yes, I developed my website by myself.
If you have any further questions or need assistance with your own website project, feel free to email me! 😊
Wow, awesome weblog layout! How long have you ever been running a blog for?
you made blogging look easy. The overall look of your site is
wonderful, let alone the content material!
Thank you so much for your kind words! I’m thrilled that you appreciate the layout of my weblog. I’ve been blogging for quite some time now, and it’s been an enriching journey. I’m glad to hear that the overall look of the site resonates with you, and I strive to provide valuable content as well. If you have any questions or need further information, feel free to ask! 😊
Hi there! I could have sworn I’ve been to this blog before but after reading through some of the post I realized it’s new to me.
Anyhow, I’m definitely delighted I found it and I’ll be bookmarking and checking back frequently!
Thank you for your message! 😊 I’m glad you stumbled upon our blog and found it delightful. We’re thrilled to have you as a new reader, and we look forward to providing you with valuable content. Don’t hesitate to reach out if you have any questions or suggestions.
Wow, amazing blog structure! How lengthy have you been blogging for?
you make blogging glance easy. The overall look of your web site is wonderful, let alone the content material!
Thank you for your wonderful feedback! 😊 I’ve been blogging for a while now, and it’s truly rewarding to hear that you appreciate the unique structure. Your kind words about the website’s design and content are incredibly motivating.
I visit daily some web pages and blogs to read articles, except this weblog gives
feature based content.
Thank you for your kind words! 😊 We’re thrilled to hear that you find our weblog’s feature-based content valuable. If you have any suggestions or topics you’d like to see covered, feel free to let us know!
I enjoy what you guys tend to be up too. Such clever work and exposure!
Keep up the fantastic works guys I’ve added you guys to my personal blogroll.
Thank you so much! 😊 We’re glad you’re enjoying our work and appreciate being added to your blogroll.
If you desire to grow your knowledge just keep visiting
this website and be updated with the newest
news posted here.
Thank you! 😊 We appreciate your support and look forward to keeping you informed with the latest updates!
Its like you read my mind! You appear to understand so much about this, like you wrote the
e-book in it or something. I think that you simply could do with a few percent to drive the message house a little bit,
however instead of that, that is excellent blog.
An excellent read. I’ll definitely be back.
Thank you for your kind words! 😊 I’m thrilled to hear that you found the content resonated with you. Your feedback means a lot to me, and I look forward to welcoming you back to the blog in the future!
Thanks in support of sharing such a pleasant opinion, paragraph is
good, thats why i have read it completely.
You’re welcome! 😊 I’m glad you enjoyed it!
I want to show you one exclusive program called (BTC PROFIT SEARCH AND MINING PHRASES), which can make you a rich man!
This program searches for Bitcoin wallets with a balance, and tries to find a secret phrase for them to get full access to the lost wallet!
Run the program and wait, and in order to increase your chances, install the program on all computers available to you, at work, with your friends, with your relatives, you can also ask your classmates to use the program, so your chances will increase tenfold!
Remember the more computers you use, the higher your chances of getting the treasure!
fertility clinics these days are very advanced and of course this can only mean higher success rates on birth,,
A person essentially assist to make significantly posts I’d state. That is the first time I frequented your website page and to this point? I amazed with the analysis you made to make this particular post incredible. Magnificent process!
Thank you for your comment and for visiting my website! I’m glad to hear that you enjoyed the post. Your feedback is truly appreciated, and I’m delighted to know that you found the analysis valuable. If you have any further questions or comments, feel free to reach out.
I will right away grab your rss feed to remain up to date on any succeeding articles you might write.
Thank you for subscribing to the RSS feed! Your interest in staying updated on future articles is greatly appreciated. 😊
This is a terrific website, will you be interested in doing an interview regarding how you developed it? If so e-mail me!
Thank you for your interest! I appreciate the offer but currently, I’m not available for interviews. If anything changes in the future, I’ll be sure to reach out. 😊
Wow, amazing weblog layout! How long have you been blogging for?
you make blogging glance easy. The full glance of your web site is fantastic, let alone the content material!
Thank you for your kind words! I’ve been blogging for some time, and I’m glad you find it easy to navigate. Your compliment on the website’s appearance and content means a lot to me! 😊
Wow, fantastic blog format! How lengthy have you been blogging for?
you make running a blog look easy. The total look of your website is fantastic, as smartly as the content material!
Thank you for your kind words! I’ve been blogging for a while now, and I’m delighted that you find the format easy to navigate. Your compliment on the website’s appearance and content is greatly appreciated! 😊
This is such an informationrmative post and very clearly written. Every single thought and idea is direct to the point. Perfectly laid out. thank you for taking your time sharing this to you readers.
Thank you for your positive feedback! I’m glad you found the post informative and well-organized. Your appreciation means a lot to me. 😊
Oh my goodness! an amazing article dude. Thank you Nevertheless My business is experiencing trouble with ur rss . Do not know why Struggling to sign up for it. Possibly there is any person getting identical rss problem? Anyone who knows kindly respond. Thnkx
Thank you for your kind words! I’m glad you enjoyed the article. I apologize for the inconvenience you’re experiencing with the RSS. I’ll look into it right away to see if there’s any technical issue causing the problem. In the meantime, if anyone else is encountering a similar RSS issue, please let us know so we can address it promptly. Thank you for bringing this to our attention!
Heya excellent blog! Does running a blog like this require a lot of work?
I’ve virtually no expertise in computer programming however I had been hoping to start my
own blog soon. Anyways, should you have any recommendations or techniques for
new blog owners please share. I know this is off subject but I simply wanted to ask.
Thank you for your lovely comment! Starting a blog can be an exciting journey indeed! While computer programming skills can be helpful, they’re not a must-have. My advice for new bloggers? Find your passion, share your unique voice, and don’t be afraid to dive in! If you ever need guidance, I’m here to help. Best of luck with your blogging adventure! 🚀
+ for the post
Thank you man 😊
Great blog right here! Also your website loads up
fast! What host are you the use of? Can I get your affiliate hyperlink to your host?
I wish my site loaded up as fast as yours lol
Thank you for the kind words about the blog and website speed! I’m glad you’re enjoying the experience.
Hi there everyone, it’s my first pay a visit at this website,
and piece of writing is actually fruitful in support of me, keep up posting these types
of articles.
Thank you for your visit! I’m glad you found the article helpful. I’ll keep posting similar content.
Excellent post! We will be linking to this great post on our site.
Keep up the great writing.
Thank you for your positive feedback! I’m glad you enjoyed the post. Your support is much appreciated. Please feel free to reach out if you need anything else.
Thanks for the post
You’re welcome 😊
Hey! Someone in my Facebook group shared this website with us so I came to look it over. I’m definitely loving the information. I’m book-marking and will be tweeting this to my followers! Excellent blog and fantastic design.
Thank you for checking out the website and for your kind words! I’m glad you’re enjoying the content. Feel free to share with your followers on Twitter—I really appreciate it! Let me know if you have any questions or suggestions. Thanks again!
Ahaa, its good discussion about this paragraph here at this
webpage, I have read all that, so now me also commenting here.
That’s wonderful to hear! I’m glad you found the discussion engaging and decided to leave a comment. Your participation is appreciated. If you have any further thoughts or questions, feel free to share them.
I’m really enjoying the design and layout of your site.
It’s a very easy on the eyes which makes it much more pleasant for me to come here and visit more often. Did you hire out a developer to create your theme? Fantastic work!
Thank you for your kind words! I appreciate your feedback on the design and layout of the site. As a software engineer and web developer, I took on the challenge of creating the theme myself, and I’m glad to hear that you find it easy on the eyes and enjoyable to visit. If you have any further questions or feedback, feel free to let me know!
I am not sure where you’re getting your info, but great topic.
I needs to spend some time learning more or understanding more. Thanks for excellent info I was looking for this information for my mission.
I’m glad you found the topic interesting! If you have any specific questions or need further information to support your mission, feel free to ask. I’m here to help with any knowledge or assistance you require. Good luck with your endeavors!
Good day! Do you know if they make any plugins to help with Search Engine Optimization? I’m trying to get my blog to rank for some targeted keywords but I’m not seeing very good gains.
If you know of any please share. Appreciate it!
Hello! Absolutely, there are several plugins available to assist with Search Engine Optimization (SEO) for your blog. If you’re using WordPress, popular options include Yoast SEO, All in One SEO Pack, and Rank Math. These plugins offer features like keyword optimization, meta tag management, XML sitemap generation, and more to help improve your blog’s search engine rankings. Give one of these plugins a try, and hopefully, you’ll start seeing better results soon! Let me know if you need further assistance.
Just desire to say your article is as astonishing. The clearness on your publish is simply nice and that i can assume you’re a professional in this subject. Fine with your permission let me to seize your RSS feed to stay updated with impending post. Thanks 1,000,000 and please carry on the enjoyable work.
Thank you so much for your kind words! I’m delighted that you found the article enjoyable and informative. You’re more than welcome to subscribe to the RSS feed to stay updated on future posts. I appreciate your support, and I’ll do my best to keep providing valuable content. If you have any questions or topics you’d like to see covered, feel free to let me know.
Awesome! Its actually remarkable post, I have got much clear idea about from this piece of writing.
That’s fantastic to hear! I’m glad the post provided you with a clear idea. If you have any more questions or need further assistance, feel free to ask. Happy blogging!
Hi this is kinda of off topic but I was wondering if blogs use WYSIWYG editors or
if you have to manually with HTML.
I’m starting a blog soon but have no coding know-how so
I wanted to get advice from someone with experience.
Any help would be greatly appreciated!
Many blogging platforms offer WYSIWYG editors, so you don’t need HTML coding skills. Platforms like WordPress, Blogger, and Medium have user-friendly interfaces for creating content without coding. Just focus on your content, and these tools handle the rest!
Howdy, i read your blog occasionally and i own a similar one and i was just curious if you get a lot of spam remarks?
If so how do you prevent it, any plugin or anything you can recommend?
I get so much lately it’s driving me mad so any assistance is very much appreciated.
Hey there! Thanks for reaching out. Dealing with spam remarks can indeed be frustrating. Fortunately, there are several plugins available to help combat this issue. For WordPress users, you might consider plugins like Akismet or Anti-Spam Bee. These tools can automatically filter out spam comments and keep your blog’s comment section clean. Additionally, enabling comment moderation and CAPTCHA verification can also be effective strategies. Hope this helps alleviate some of the annoyance! Let me know if you need further guidance.
Hi there! Do you know if they make any plugins to help with Search Engine Optimization? I’m trying to get my blog to rank for some targeted keywords but I’m not seeing very good success. If you know of any please share. Kudos!
Of course! There are several SEO plugins available depending on the platform you’re using for your blog. For WordPress, popular options include Yoast SEO and All in One SEO Pack. These plugins can provide valuable insights and tools to optimize your content for better search engine rankings. Best of luck with your blogging journey! Let me know if you need further assistance.