
For implementing Simple Linear Regression in Python, we have to understand some basics about Linear Regression. Please read this blog first to this – What is Linear Regression?
I hope, currently you know some basics about Linear Regression. Now for implementing Simple Linear Regression, we have to follow some steps. Those steps are given below.
Step 1: First we need a clean a dataset. I use this SimpleLinearRegression.csv dummy dataset for this implementation. This dataset has two variables, YearsExperience and Salary. YearsExperience is our Independent Variable and Salary is our Dependent Variable. You also can use this dataset for practice. Download it from this Link.
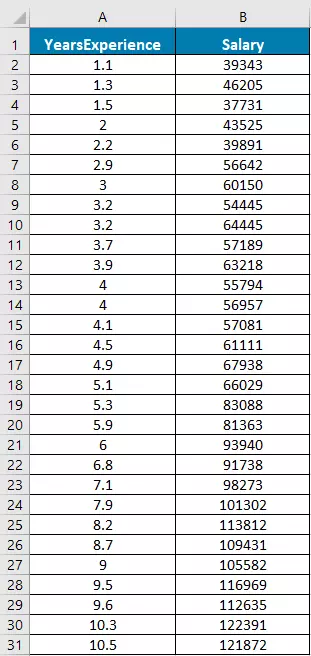
Step 2: Import pandas library. Use read_csv() function for importing the csv file and print it to check whether csv file is imported successfully or not.
import pandas as pd

df = pd.read_csv('SimpleLinearRegression.csv')

print(df.head())
Step 3: Put our independent variable, YearsExperience into X variable and put dependent variable, Salary into y variable.
X = df[['YearsExperience']]

y = df[['Salary']]
Step 4: For training our model, we have to split our variables X, y into X_train, y_train, X_test and y_test. And for doing this we have to import a library train_test_split from sklearn.model_selection
from sklearn.model_selection import train_test_split

X_train,  X_test, y_train, y_test = train_test_split(X, y, test_size = 1/3, random_state = 42)
Step 5: Now we are ready for applying Linear Regression. First import LinearRegression library and then create a Linear Regression object/model. Then fit the model with X_train and y_train variables. Use predict() function to find out y_prediction. Now our model is ready for rest calculation.
from sklearn.linear_model import LinearRegression

regressor = LinearRegression()

regressor.fit(X_train, y_train)

y_pred = regressor.predict(X_test)
Step 6: Now for calculating MAE, MSE, RMSE and R_Squared, we used build-in functions mean_absolute_error(), mean_squared_error() and r2_score().
from sklearn import metrics

mae = metrics.mean_absolute_error(y_test,y_pred)
mse = metrics.mean_squared_error(y_test,y_pred)
rmse = metrics.mean_squared_error(y_test,y_pred)**.5
r_squared = metrics.r2_score(y_test,y_pred)

print(mae)
print(mse)
print(rmse)
print(r_squared)
Bonus part: We can also plot our Linear Regression graph. In this code below I plotted graph for training dataset.
import matplotlib.pyplot as plt

plt.scatter(X_train, y_train, color='red')
plt.plot(X_train, regressor.predict(X_train), color='blue')
plt.title('Salary vs. Years (For training set)')
plt.xlabel('Years of experience')
plt.ylabel('Salary')
plt.show()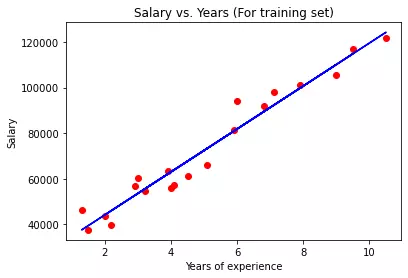
I also plotted graph for Testing dataset.
plt.scatter(X_test, y_test, color='red')
plt.plot(X_test, regressor.predict(X_test), color='blue')
plt.title('Salary vs. Years (For Test set)')
plt.xlabel('Years of experience')
plt.ylabel('Salary')
plt.show()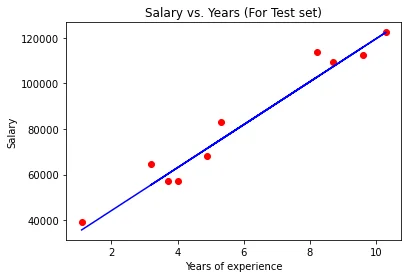
Full code:
import pandas as pd
from sklearn.model_selection import train_test_split
from sklearn.linear_model import LinearRegression
from sklearn import metrics
import matplotlib.pyplot as plt

df = pd.read_csv('SimpleLinearRegression.csv')
print(df.head())

X = df[['YearsExperience']]
y = df[['Salary']]

print(X.head())
print(y.head())

X_train,  X_test, y_train, y_test = train_test_split(X, y, test_size = 1/3, random_state = 42)

regressor = LinearRegression()
regressor.fit(X_train, y_train)
y_pred = regressor.predict(X_test)

mae = metrics.mean_absolute_error(y_test,y_pred)
mse = metrics.mean_squared_error(y_test,y_pred)
rmse = metrics.mean_squared_error(y_test,y_pred)**.5
r_squared = metrics.r2_score(y_test,y_pred)

print(mae)
print(mse)
print(rmse)
print(r_squared)

plt.scatter(X_train, y_train, color='red')
plt.plot(X_train, regressor.predict(X_train), color='blue')
plt.title('Salary vs. Years (For training set)')
plt.xlabel('Years of experience')
plt.ylabel('Salary')
plt.show()

plt.scatter(X_test, y_test, color='red')
plt.plot(X_test, regressor.predict(X_test), color='blue')
plt.title('Salary vs. Years (For Test set)')
plt.xlabel('Years of experience')
plt.ylabel('Salary')
plt.show()
➤ If you want to learn, own implementation of Simple Linear Regression, then click here
➤ If you want to learn, Datacamp course – “Supervised Learning with scikit-learn” – then click here.
Thank you for reading my blog. If you have any query about this code, feel free to ask by comment. Thank you again.
